Forgot bit locker pin, forgot bit locker recovery key, 5 Easy ways to fix
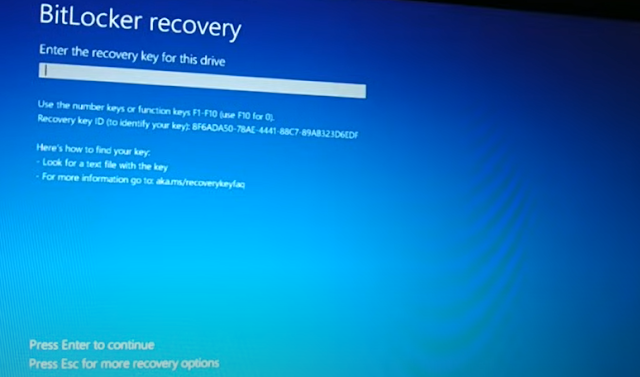
Did you forgot your bit locker pin and recovery key. Try these methods, I hop it help you. 1. When you see this screen, Press "Esc" key in your keyboard for more recovery option. It will say preparing BitLocker recovery, You will see the screen bellow in few minute. Here we will click on "Skip the drive", You will see the screen bellow. Here you need to Turn off your PC, and then enter the BIOS of your PC. In order to enter BIOS, check for your PC brand and model and search on google, how to enter BIOS for your particular brand and model of your PC. Search for "Secure Boot" Enable it and check it, if it works for you. If it do not work, come back to same place and Disable "Secure Boot" and try again, see if it work for you. 2. If the above method do not work for you, try resetting your PC, You can choose any of the two option for resetting your PC, "Keep my files" or "Remove everything" whichever works for you. 3. If the abov...